
Projects
Showcasing some of my latest personal developments & endeavorsAlthough mostly transit-related, the below tools and analyses reflect tools and projects created and undertaken in my own time / separate from work engagements.
Click any below to learn more and/or access the tool
Multiboard
A customizable real-time departure board for more than a dozen agencies
TransitNotify
Live push notifications for train statuses
Special Set Notifier
Push notifications for special equipment operations
GPS Data Auditor
Tool for auditing transit real-time GPS & prediction data
TurnFinder
A tool to identify "out-and-back" turns on revenue trains
Stringliner
Customizable transit system "stringline" time-distance diagrams
Excel2GTFS
A tool that makes creating GTFS on simple networks relatively easy
Walk Scores by Station
Interactive plot of Walk Score® by station on various rail networks
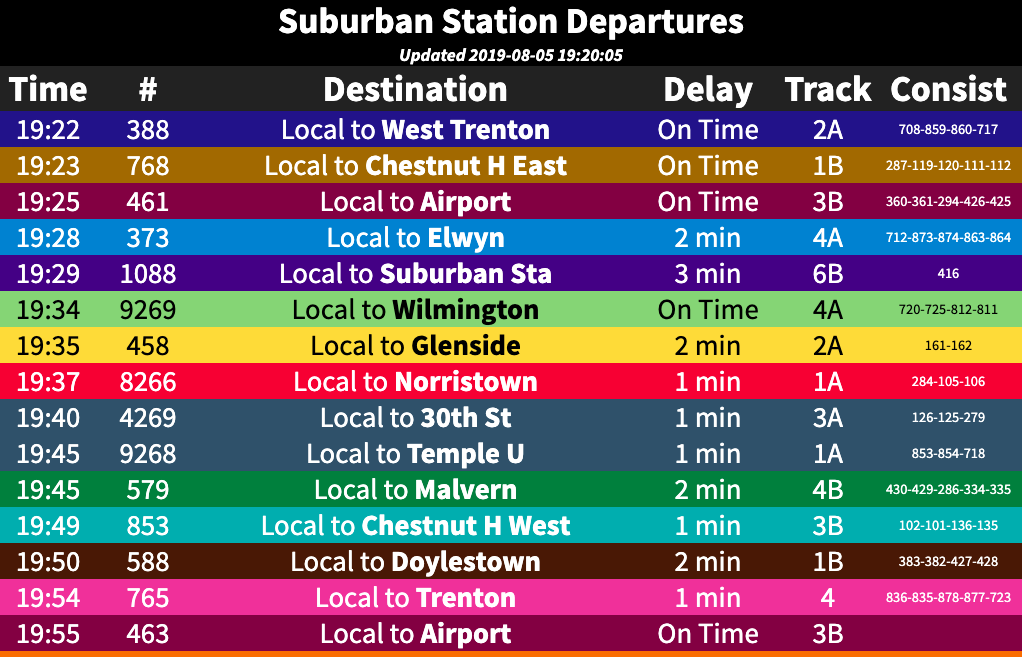
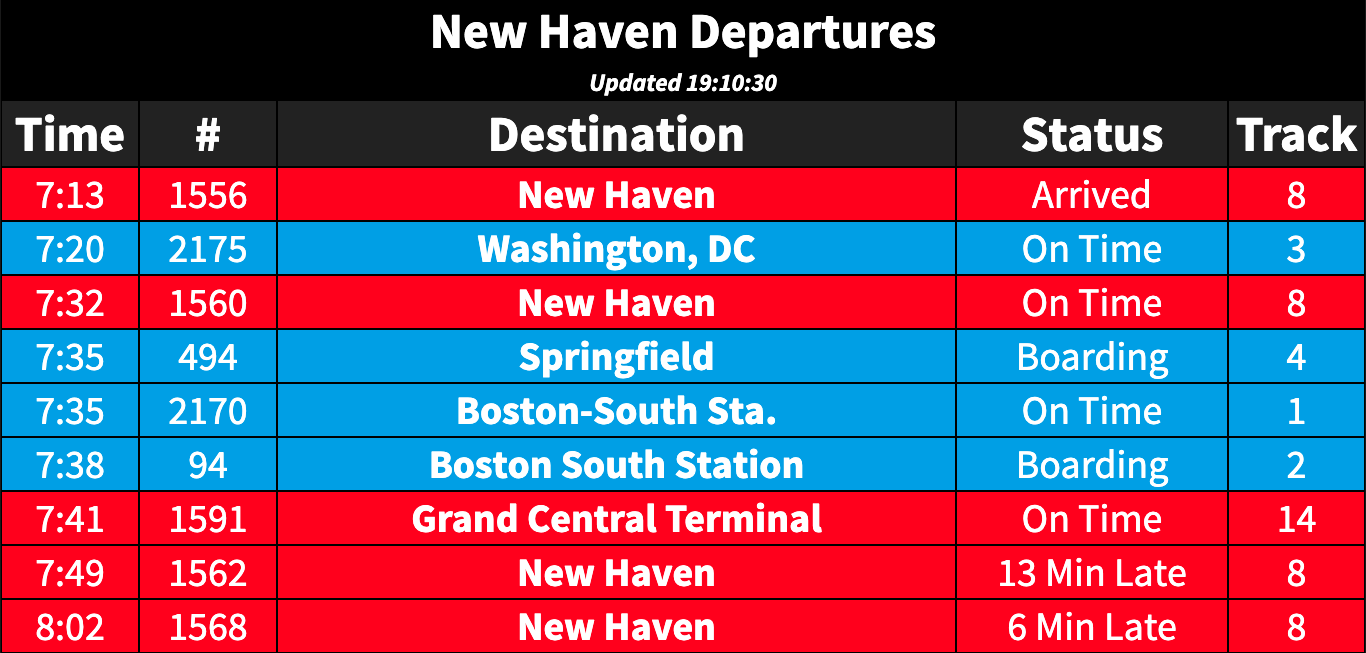
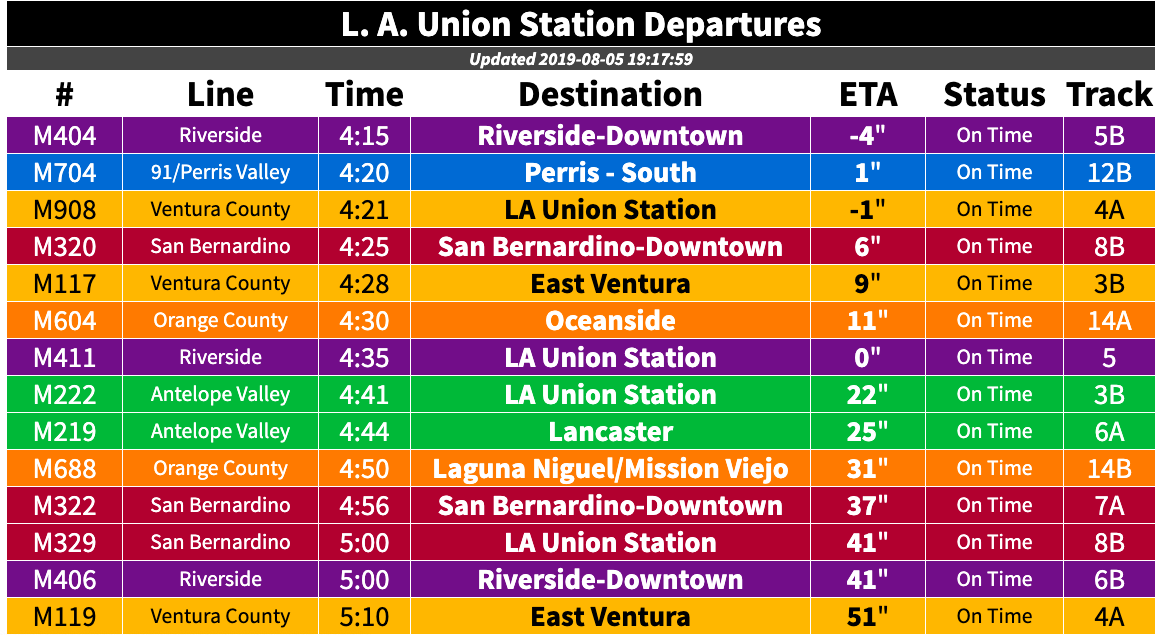
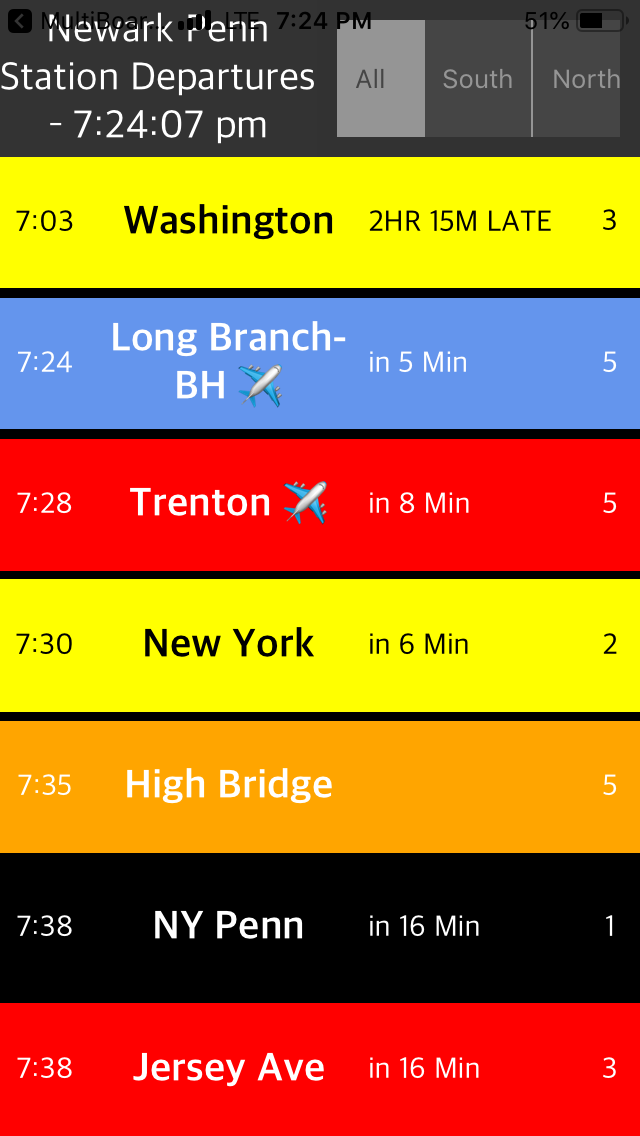
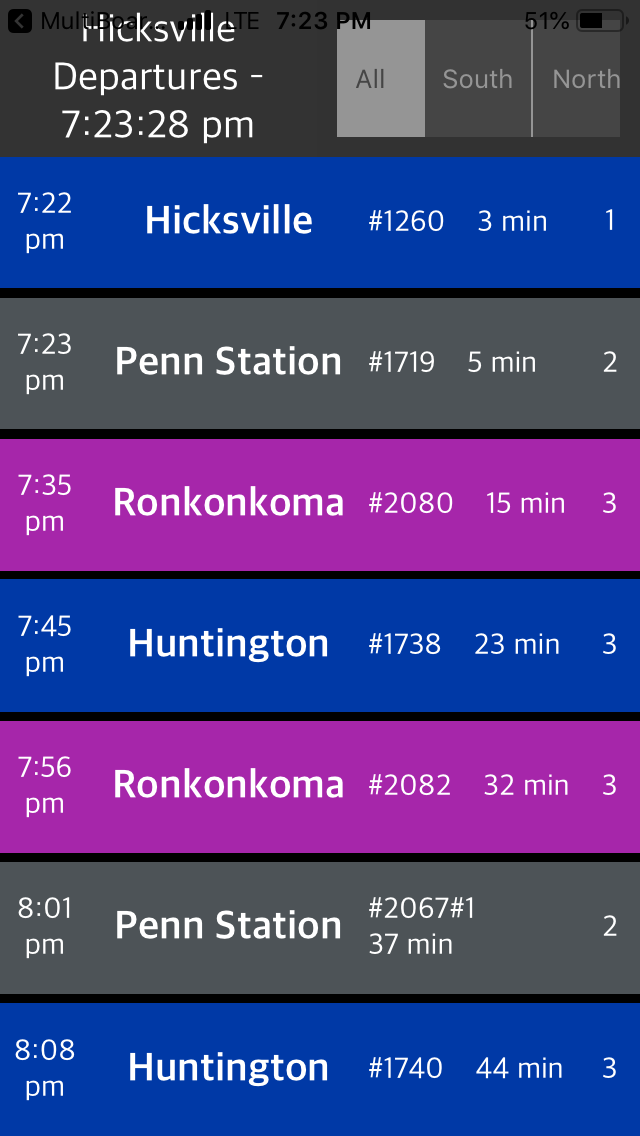
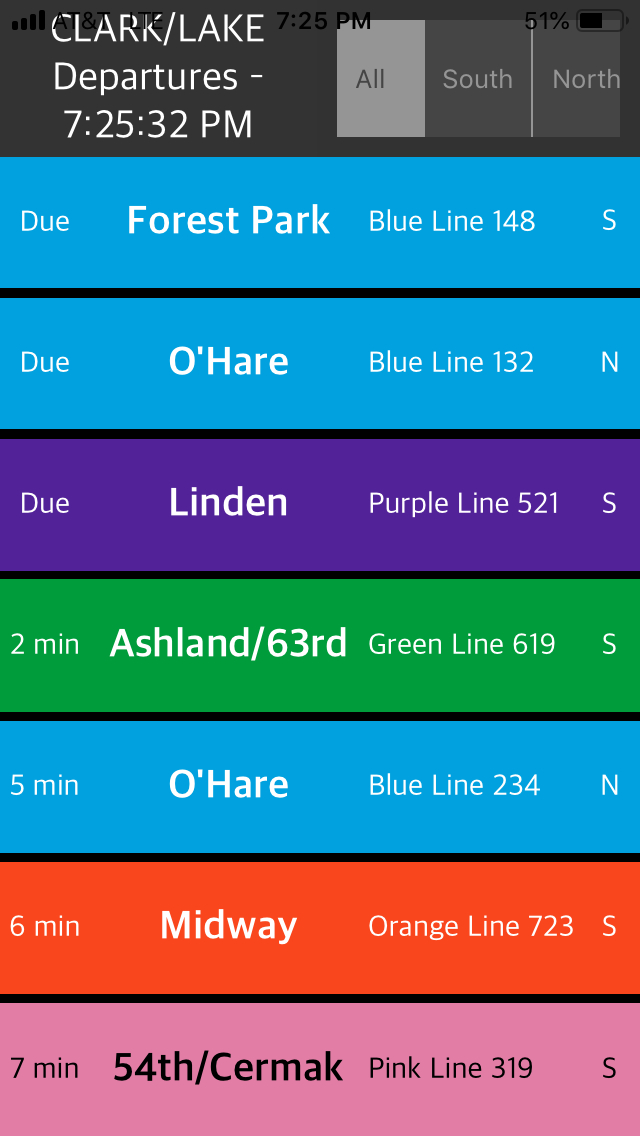
Multiboard
Departure boards are often the hallmark of iconic transportation systems, so much so that the signs often become icons themselves. However, there's a lack of clarity, information, and unification across systems and designs. That's where Multiboard comes in.
Powered by Python and Flask, Multiboard integrates with more than 15 of North America's largest transportation systems to provide users with a customizable, visually-appealing, and powerful departure board for any station in the system.
Multiboard: it's your multi-tool for transit system departure boards.

TransitNotify
With intercity travel, trips are notorious for shifting delay levels, especially when considering built-in schedule padding. TransitNotify is a tool that provides real-time push notifications for various intercity carriers, including Amtrak via the exceptional asm.transitdocs.com site, Greyhound, various Commuter Railroads (e.g. NJT, SEPTA, MBTA CR), and more.
Be it figuring when to depart, knowing where you currently are, or where someone is that you need to meet, TransitNotify keeps you in-the-know with exactly where you are and the operator's upcoming predicted times.

Special Set Notifier
Although transit enthusiasts and railroad photographers have plentiful access to content on various networks, one of the more difficult activities is identifying when and where more elusive equipment is operating.
The Special Set Notifier is a tool built on the ntfy.sh platform that provides subscribable push notifications for various special operating conditions.
To subscribe, download the ntfy.sh app from your app store and subscribe to the indicated keyword below.
- SEPTA Regional Rail Push-Pull Bombardier Equipment [septa-rrd-pushpull-tracker]
- SEPTA Regional Rail Heritage Schemes [septa-rrd-heritage-tracker]
- SEPTA PCC Trolley Operations [septa-pcc-trolley-tracker]
- SEPTA "Special" Trolleys (e.g. Holiday & Heritage Schemes) [septa-special-trolley-tracker]
- MBTA Red Line New Set Tracker [mbta-new-vehicle-tracker]
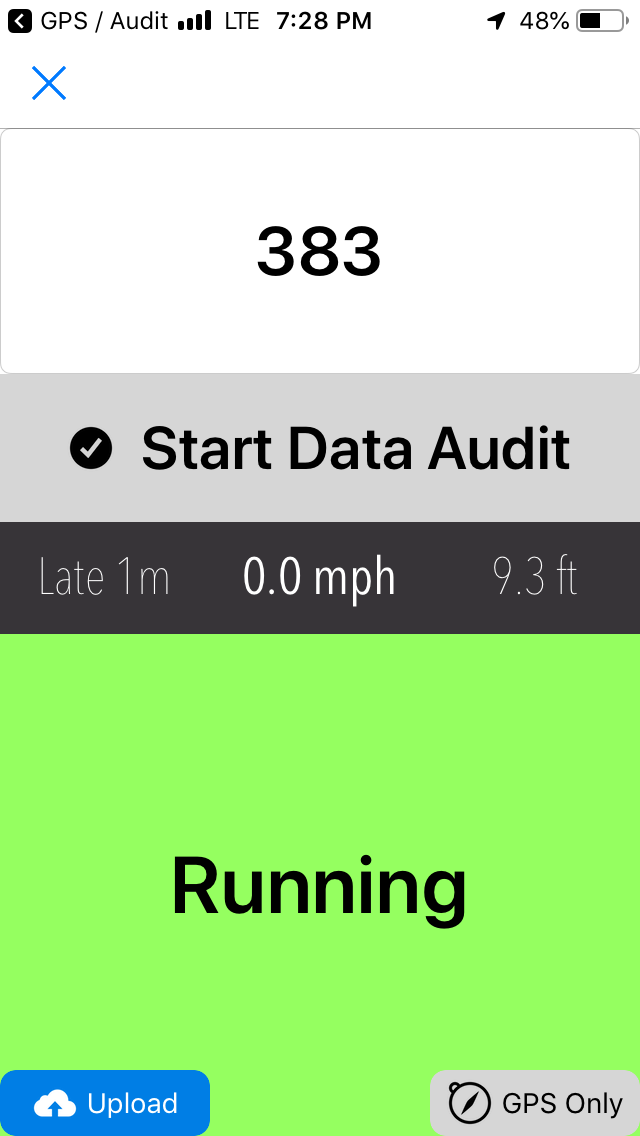
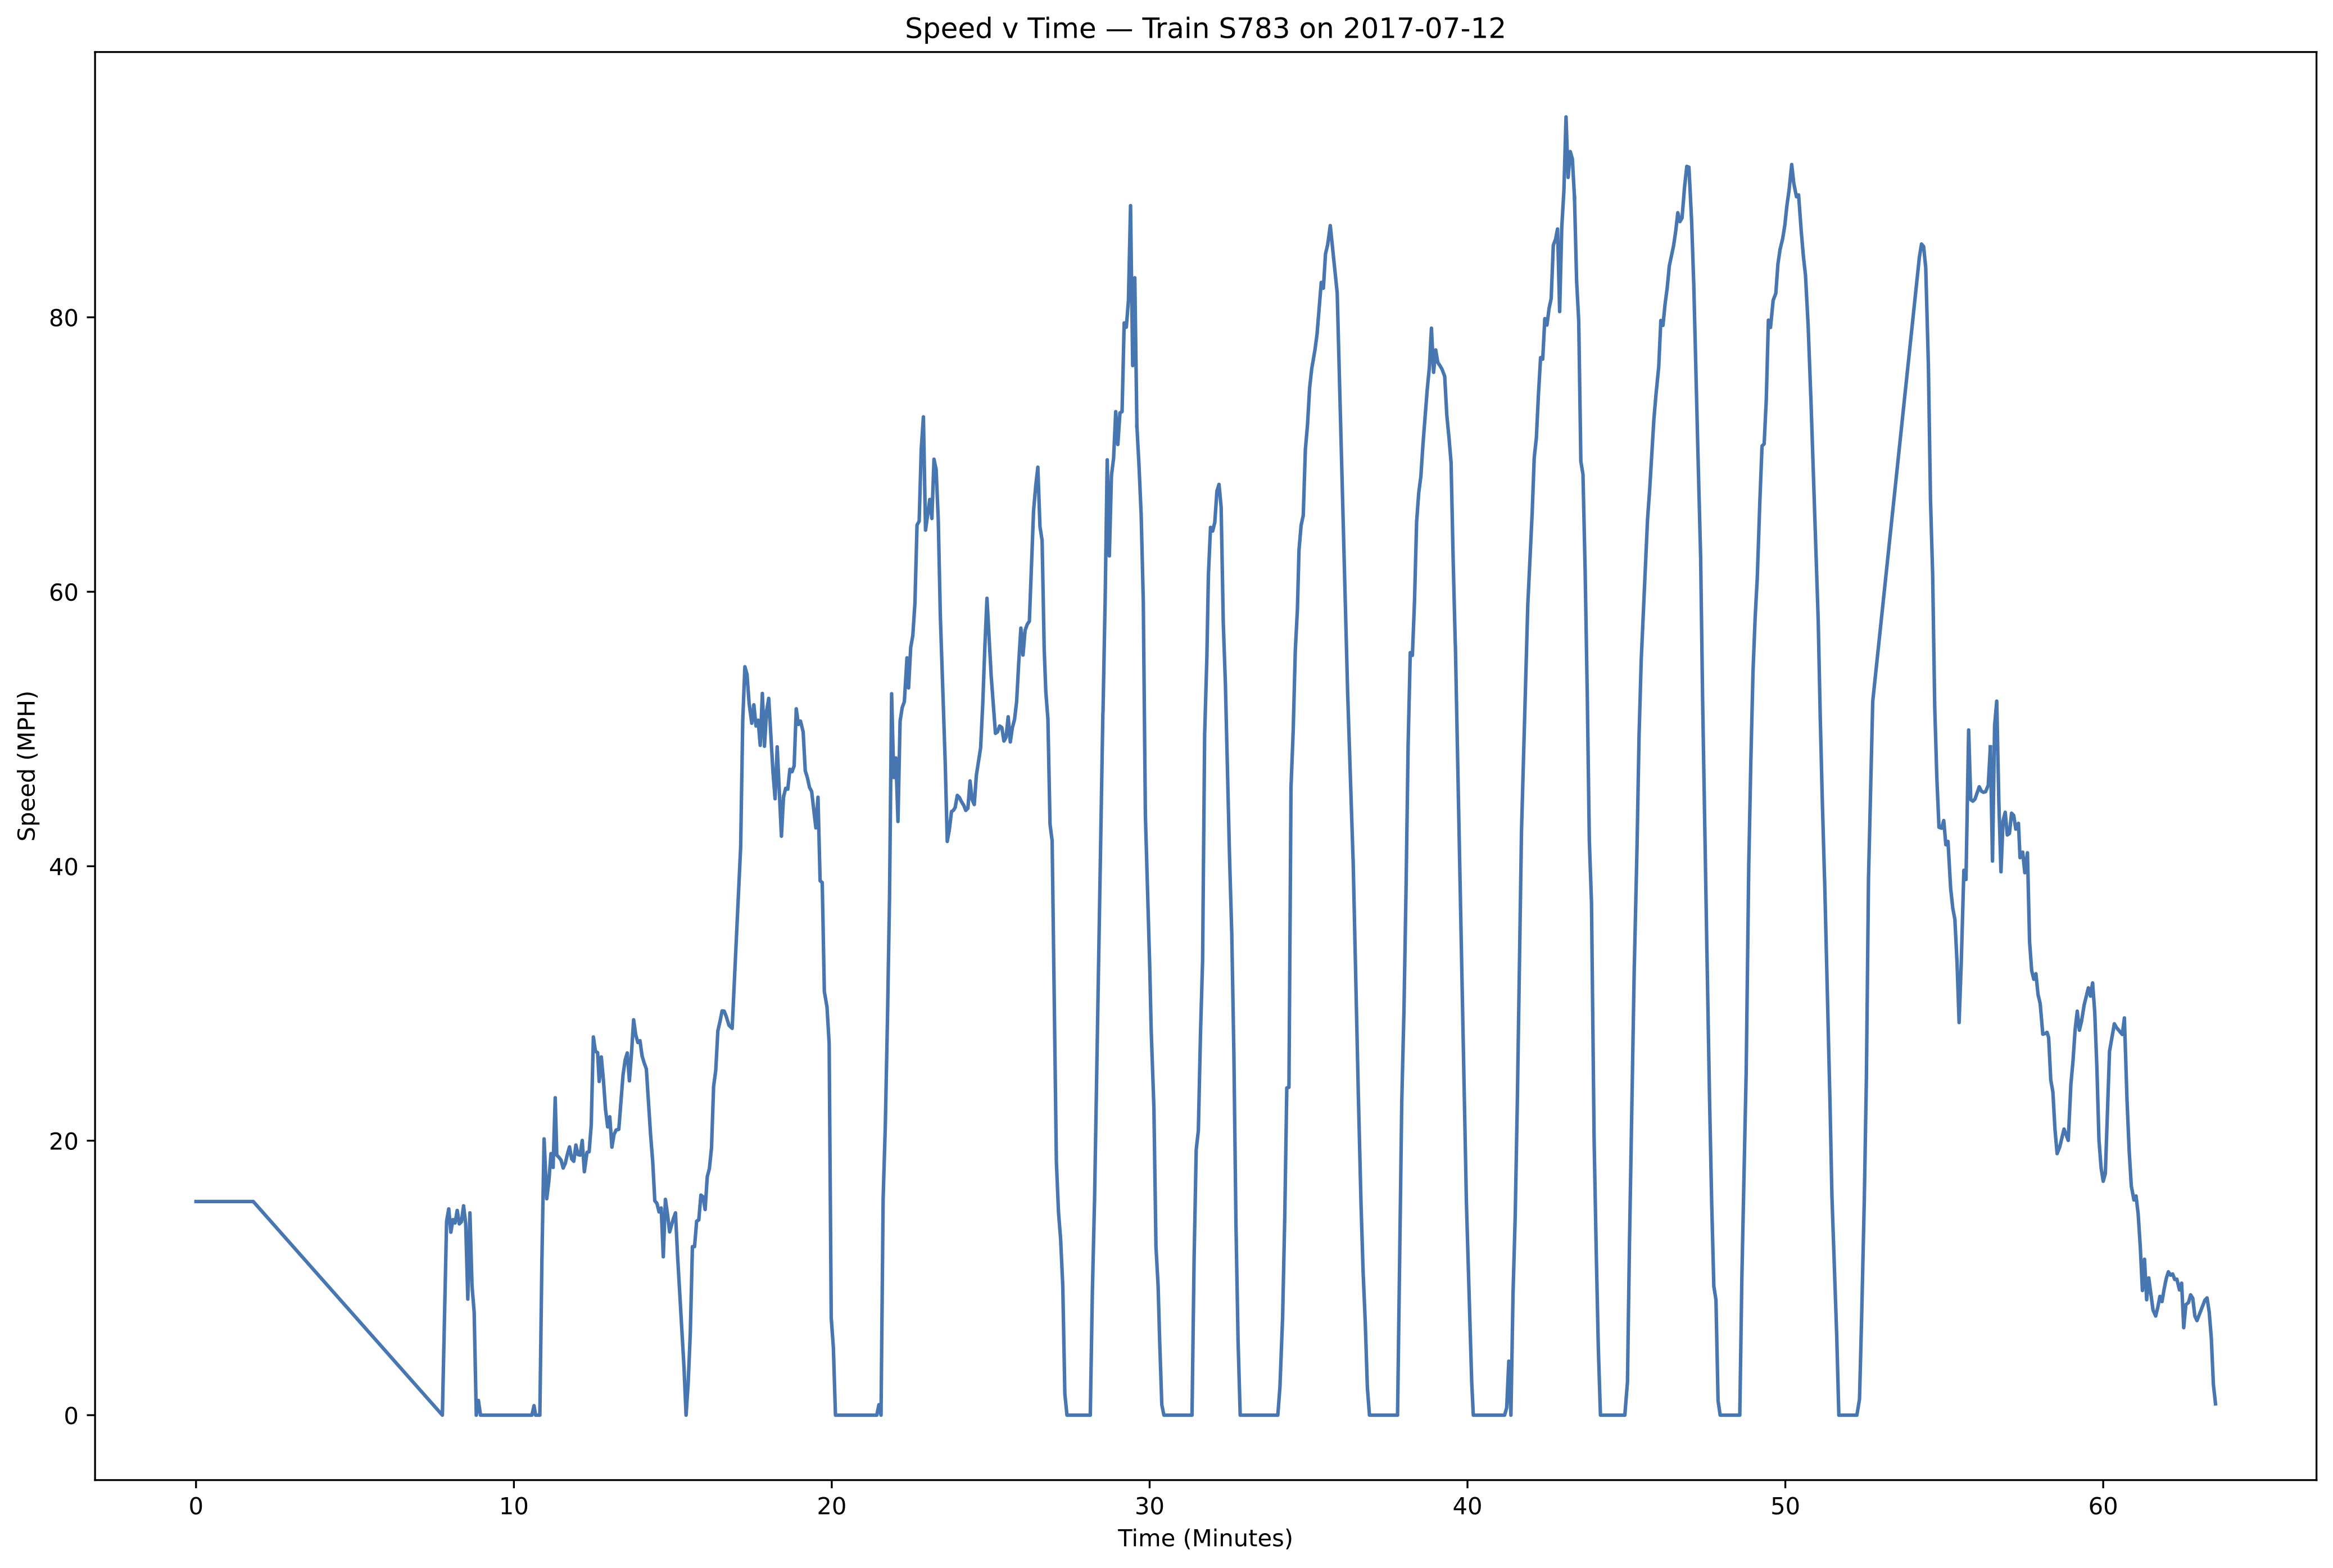
GPS Data Auditor
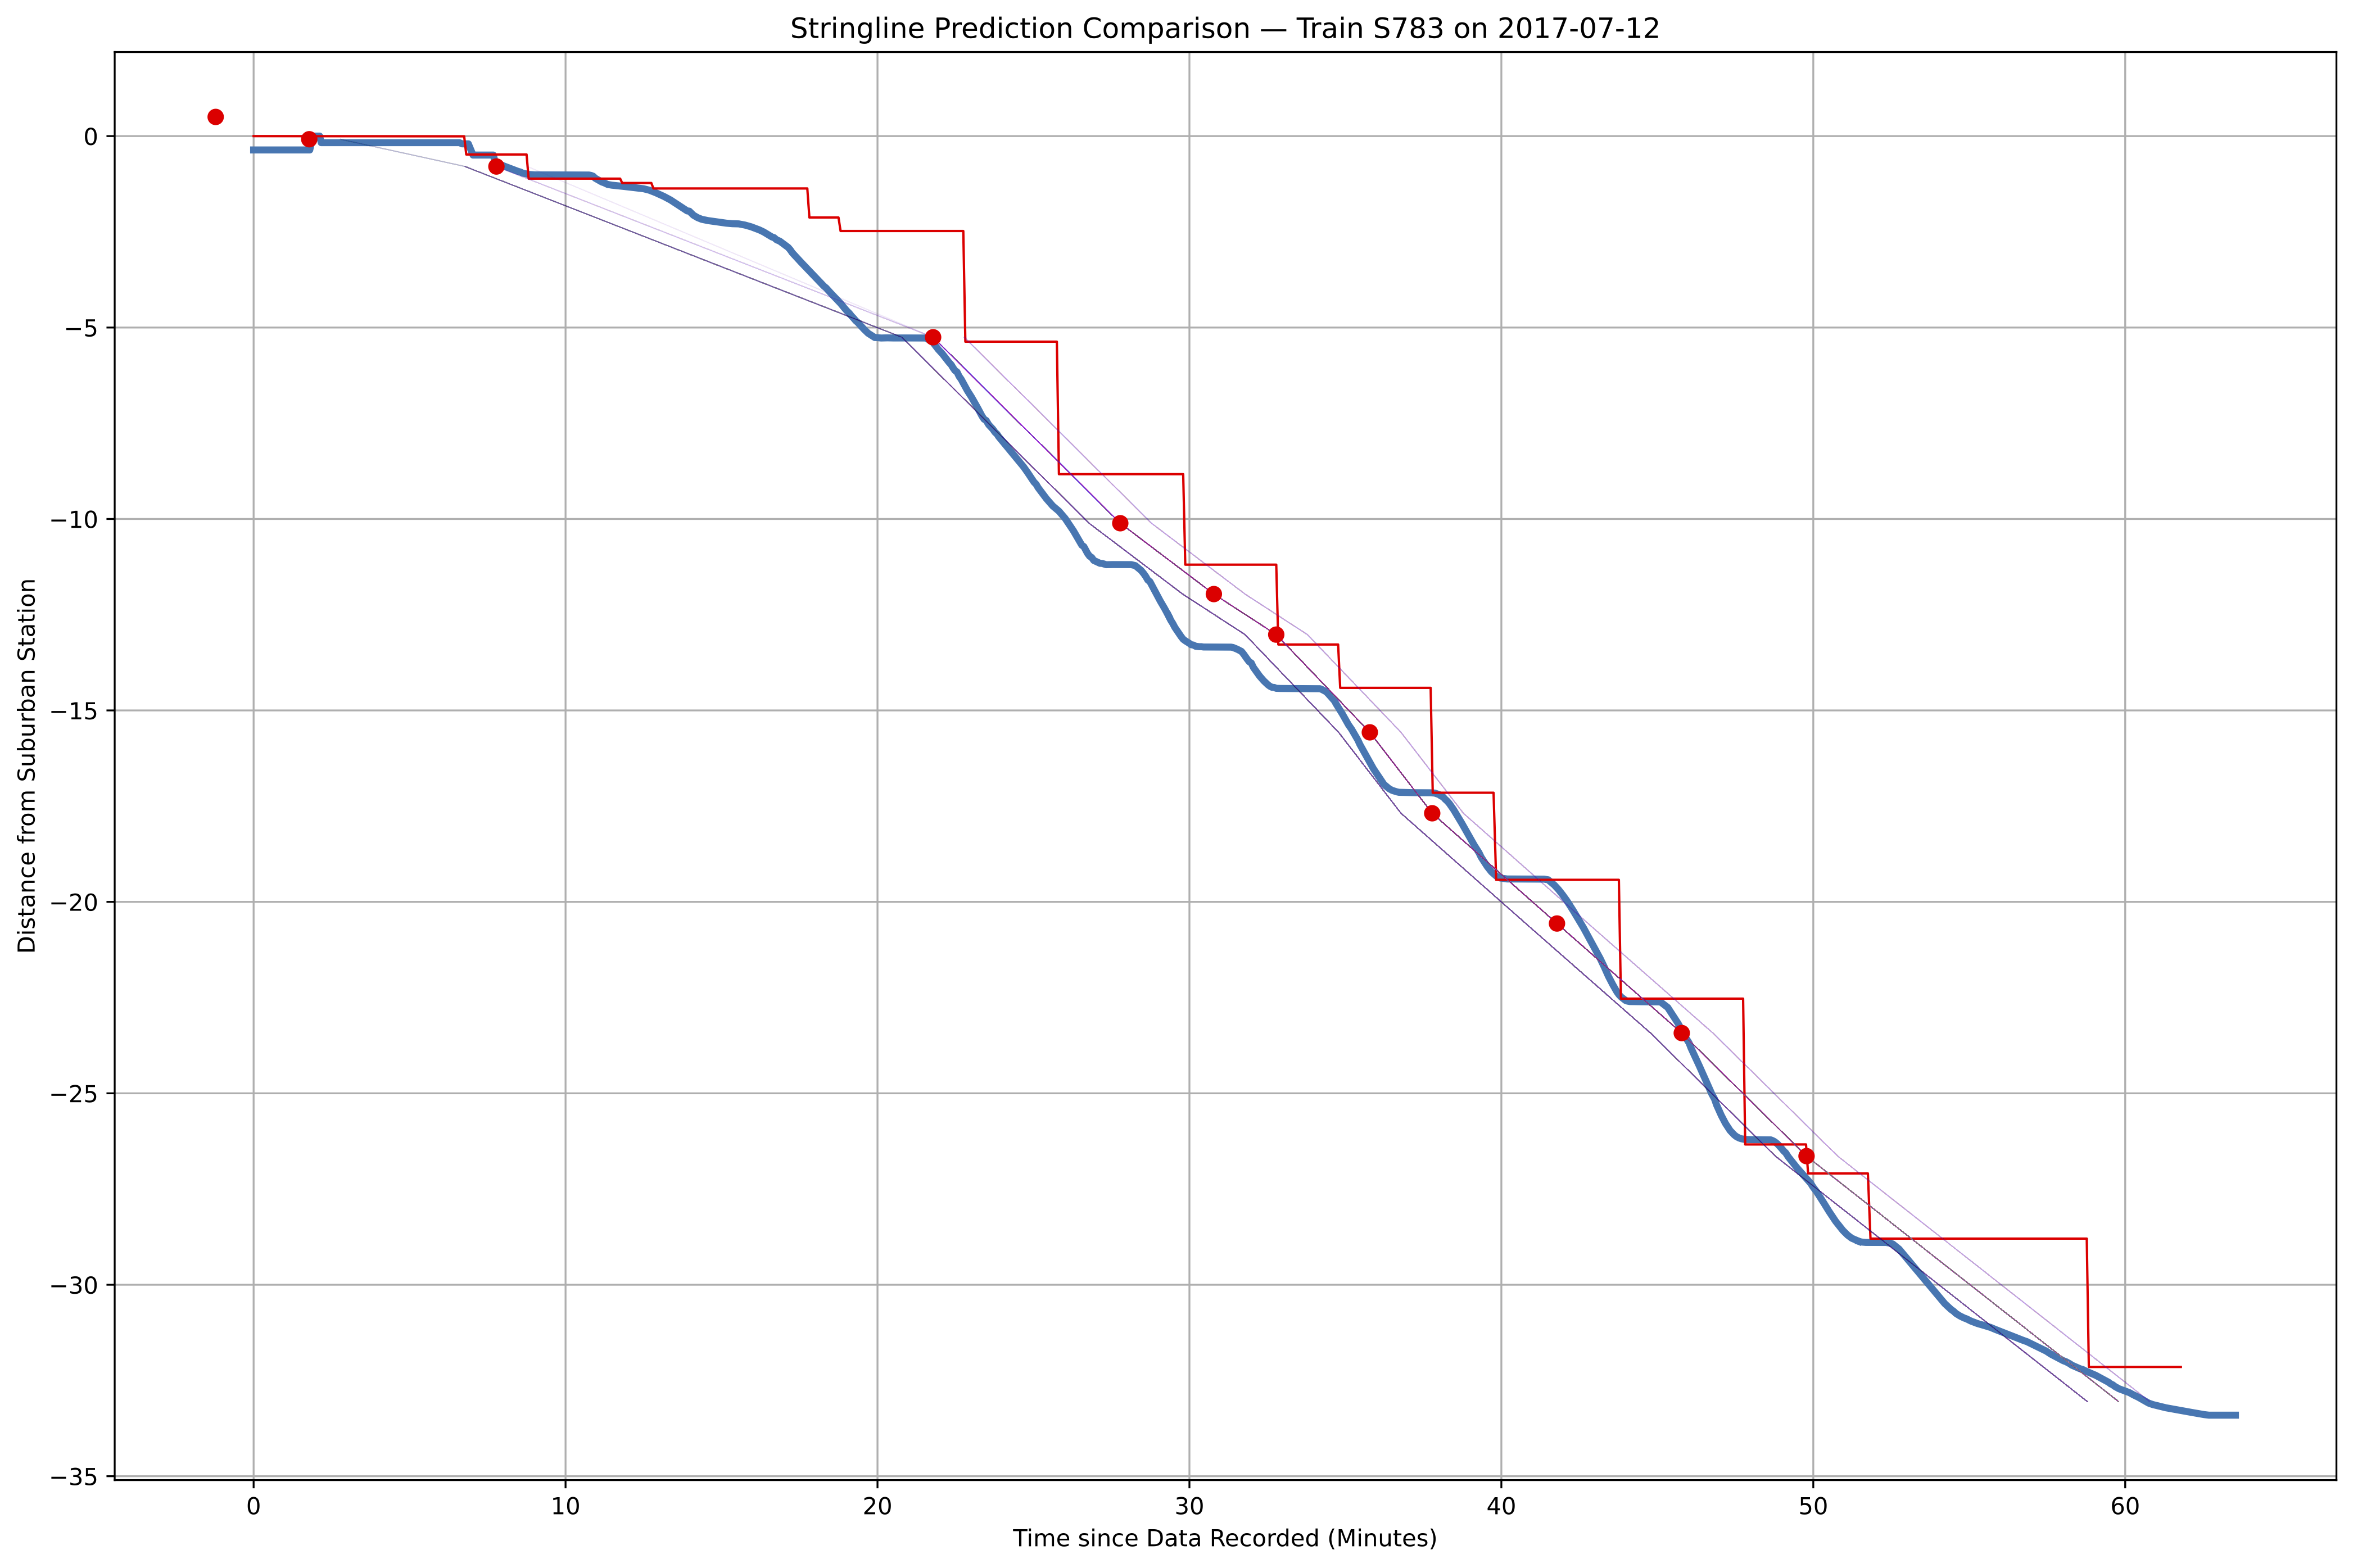
Serving as the basis for a data audit that galvanized SEPTA to invest in better real-time data, the GPS Data Auditor tool simultaneously captures live GPS data from a user's phone alongside an agency's real-time location and prediction data for the given vehicle/trip. Afterwards, the data can be compared to analyze the real-time GPS information and prediction accuracy.

Turn Finder
When exploring transit systems, professionals and hobbyists frequently wind up taking a train to an outlying point, only to return back to their origin via another train (also known as one's "turn").
Turn Finder identifies possible turn options and provides a simple list of candidate turns for any given trip. Features include options for adjusting minimum turn lengths, filtering to only show options departing after or returning before given times, and excluding turn locations from the result set. Outputs are available in console text, CSV, as well as a visual HTML table.
Use & Samples
To use the output, find a train in the origin portion of the list. The right side of the table displays possible return trip connections, the turn time, and the total journey duration. Unless otherwise specified, sample output turns are calculated with a minimum 5-minute scheduled connection time, excluding turn options at nearby terminal stations.
Accessing Data
Where available, data is automatically generated overnight to show up-to-date turns on many major systems. Reference the below table to find turns by system.
| MBTA CR | Today | Tomorrow | Day after Tomorrow |
| MNR | Today | Tomorrow | Day after Tomorrow |
| LIRR | Today | Tomorrow | Day after Tomorrow |
| Amtrak (NYP) | Today | Tomorrow | Day after Tomorrow |
| NJT (Newark Penn) | Today | Tomorrow | Day after Tomorrow |
| NJT (Newark Broad) | Today | Tomorrow | Day after Tomorrow |
| NJT (Hoboken) | Today | Tomorrow | Day after Tomorrow |
| NJT (Lindenwold) | Today | Tomorrow | Day after Tomorrow |
| Amtrak (PHL) | Today | Tomorrow | Day after Tomorrow |
| SEPTA | Today | Tomorrow | Day after Tomorrow |
| MARC | Today | Tomorrow | Day after Tomorrow |
| Tri-Rail | Today | Tomorrow | Day after Tomorrow |
| GO | Today | Tomorrow | Day after Tomorrow |
| NICTD South Shore Line | Today | Tomorrow | Day after Tomorrow |
| METRA | Today | Tomorrow | Day after Tomorrow |
| Caltrain | Today | Tomorrow | Day after Tomorrow |
Note that the system does not presently account for stations where shorter turns are viable (due to single-track territory), connecting train options, or for express trips where a subsequent turn at the same station returns before an earlier turn (provided both are before the stated latest return time). These are all features for addition in a subsequent version.
Disclaimer: Use of any aspect of the tool / its outputs is done entirely at the user's own risk. Materials presented herein are done with no representation nor warranty, neither explicit nor implied, as to the information's accuracy, and is subject to no standard of reasonableness. Use constitutes a full acceptance for any liability resulting from use of these materials, and an agreement to hold harmless and waive any and all claims against the provider.
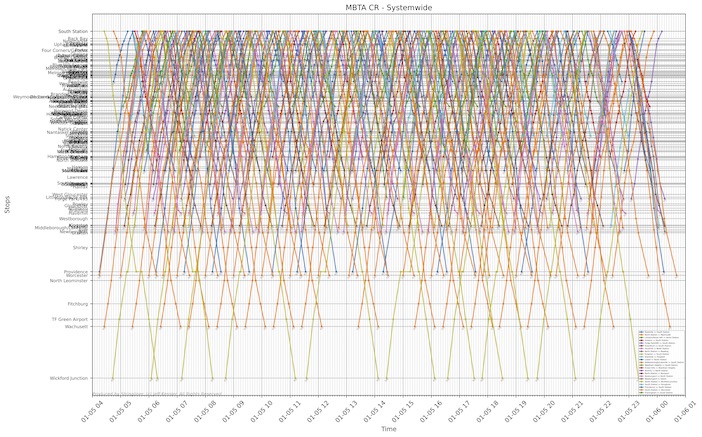
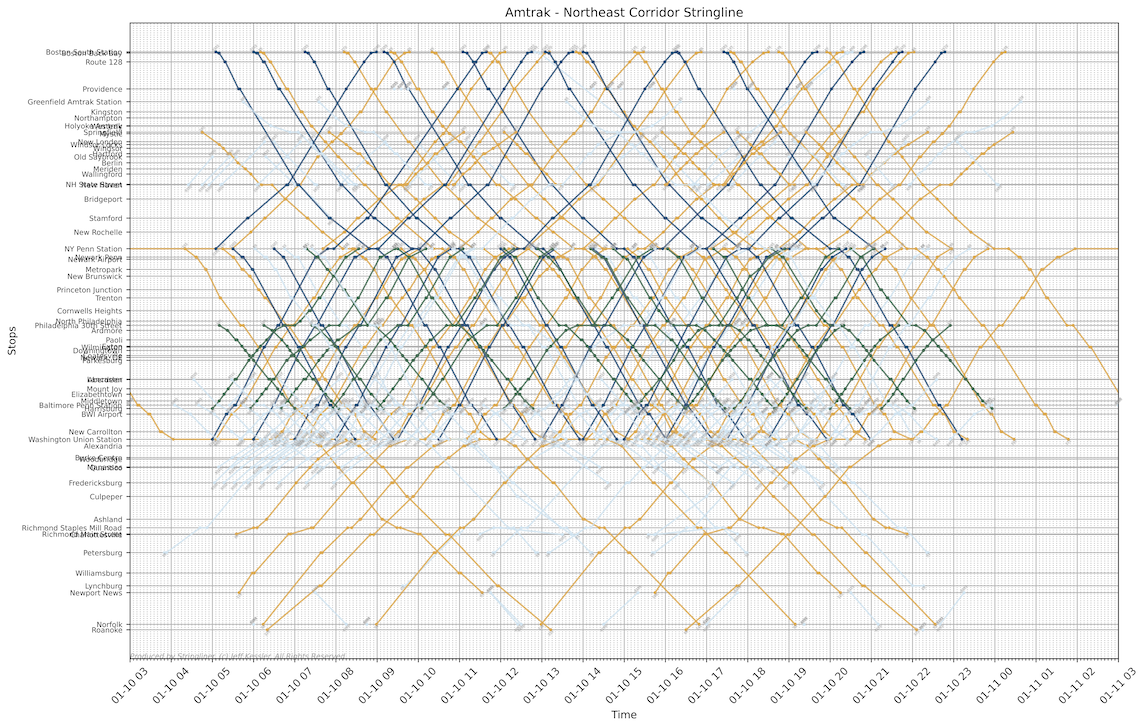
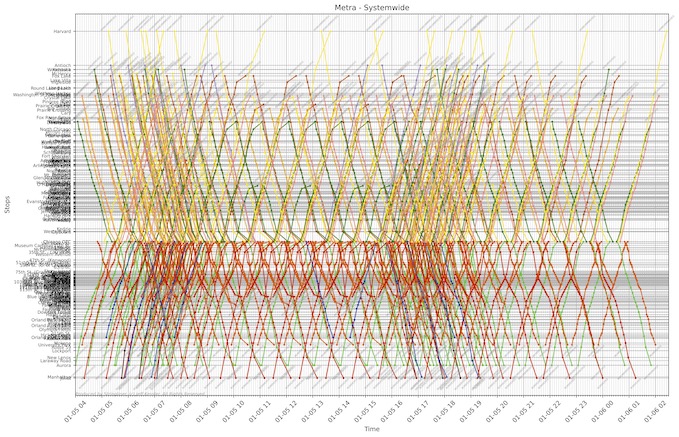
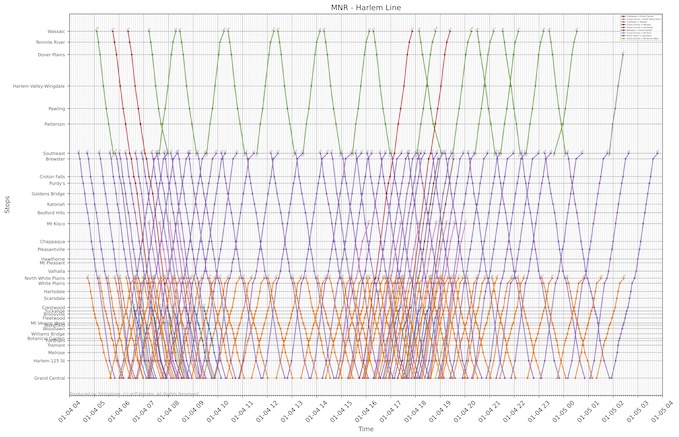
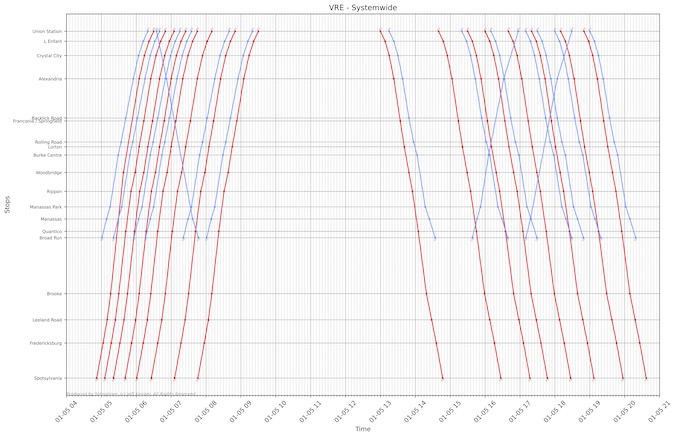
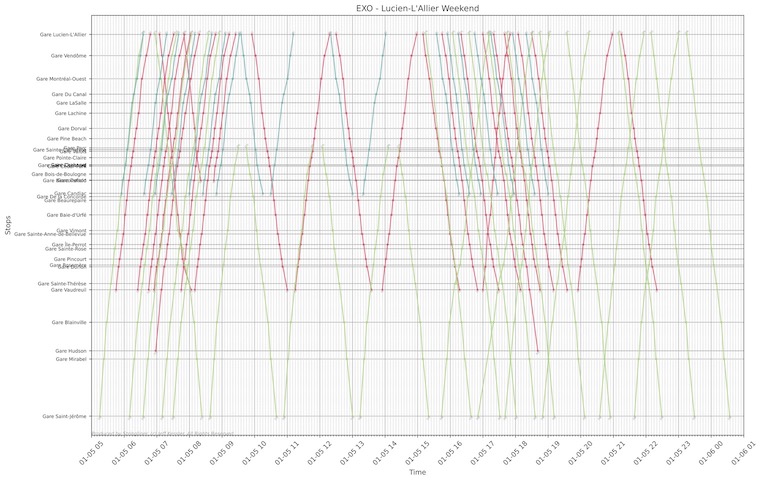
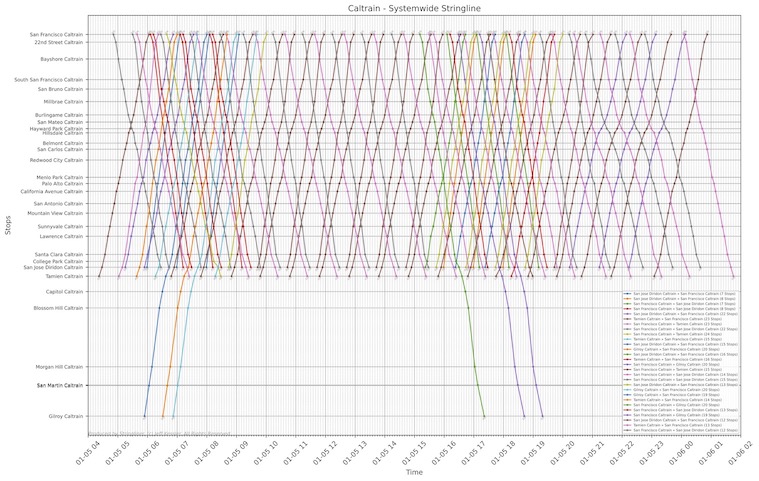
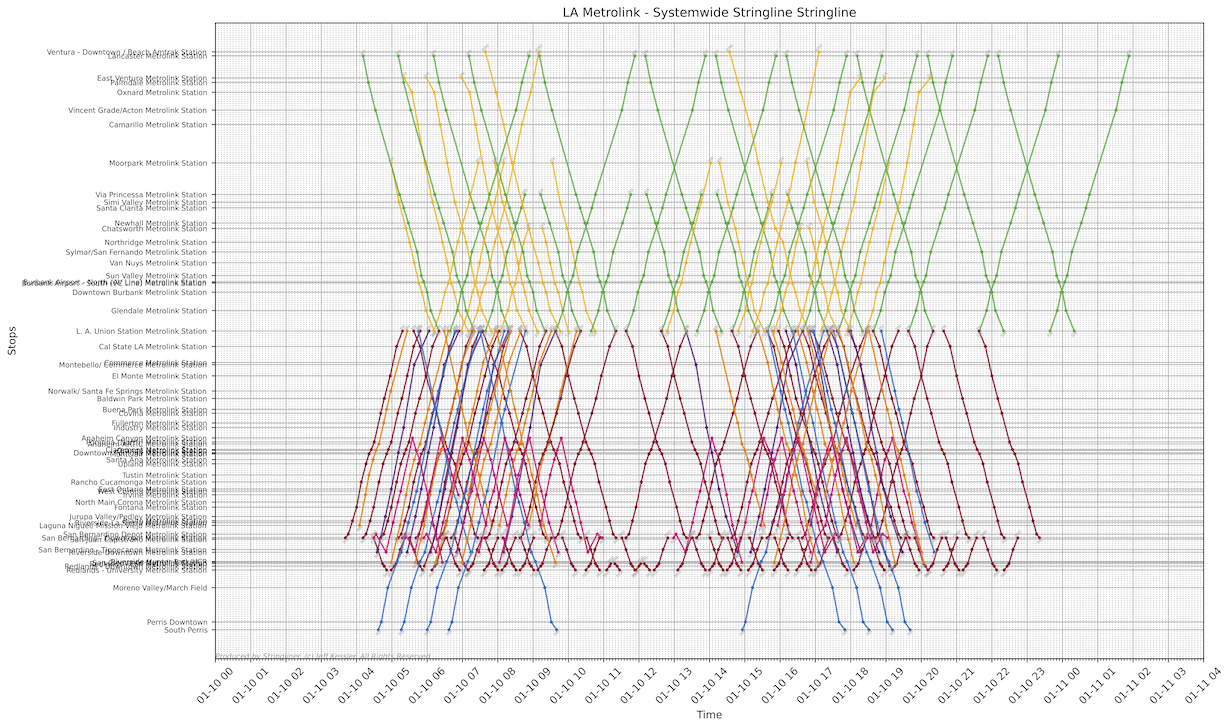
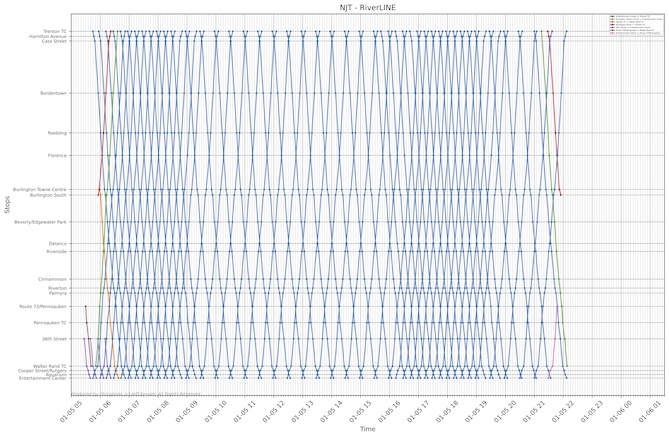
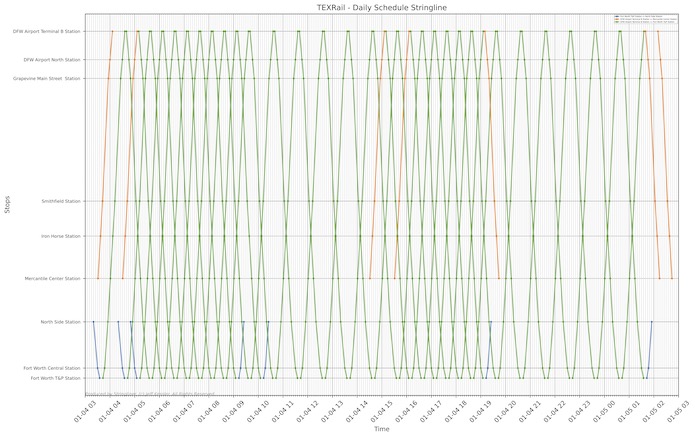
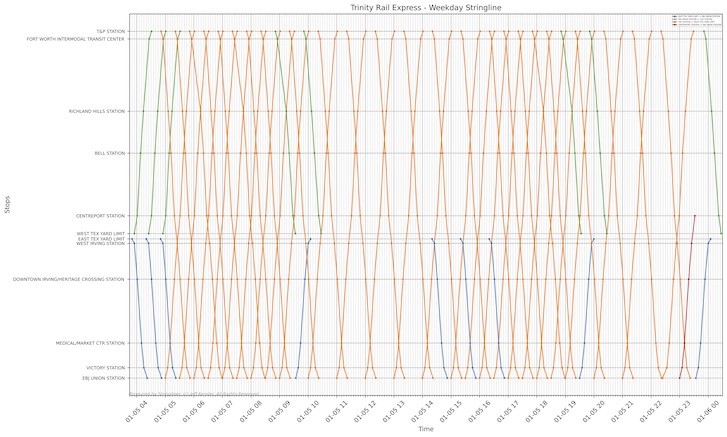
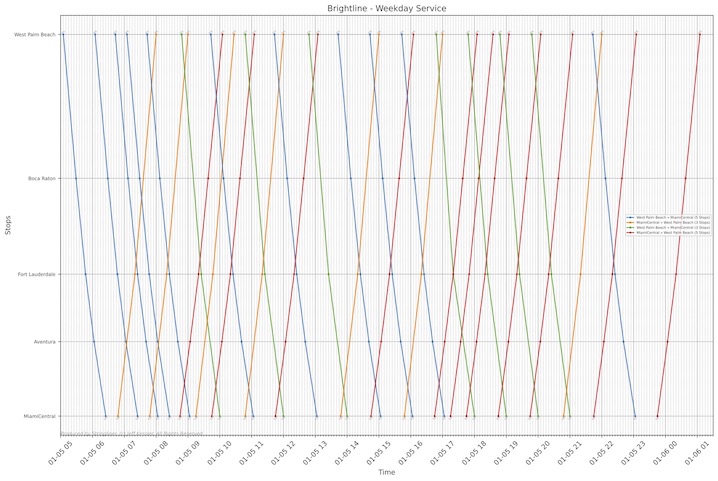
Stringliner
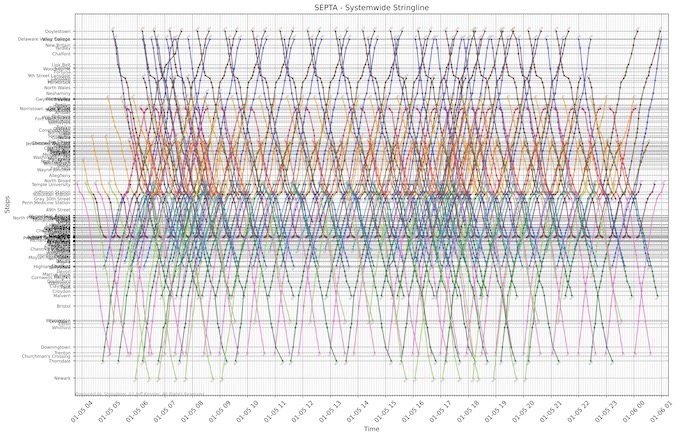
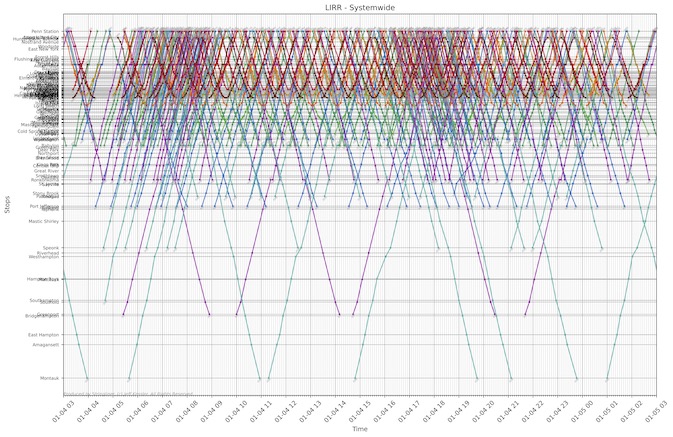
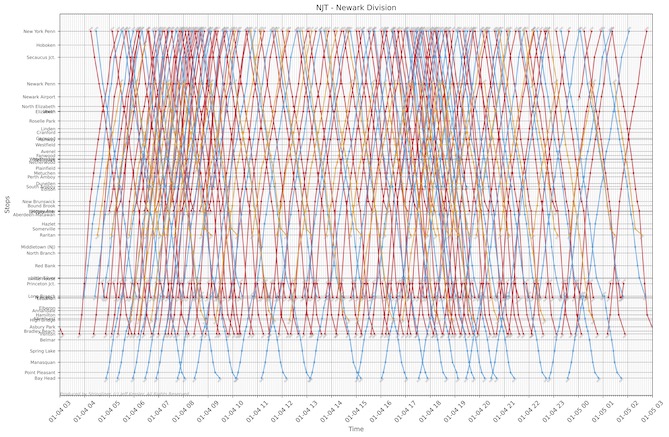
Transportation planners have relied on "stringline" diagrams since the dawn of the profession given their easy ability to visually convey factors like frequency, headway, speed, single-track conflicts, and more. But instead of needing a straight-edge, ruler, and pushpins, Stringliner is here to produce stringline diagrams for the modern era.
Using the industry-standard GTFS data format for transportation information, Stringliner can produce a multitude of stringline visualizations with customizations for locations to plot, stop markers, coloring by line/direction/trip, combined lines with different reference locations, and more. You can also use a separate inventory of milepost locations and reference markers should you wish to further customize a line's display.
BYO GTFS and use its shape data, the existing milepost references, or add your own. You're only minutes away from easy stringline visualizations… just without the expensive software cost (as is typical in the industry).
See a gallery of sample plots below, or "Access Today's Stringlines" below to see automatically-generated stringline plots for today's schedule on many major operations
Excel2GTFS
With GTFS data being the primary means of modeling transportation operations in customer-facing touchpoints (e.g. digital signage, websites, mapping applications, predictive data baselines, etc.), being able to robustly produce updated GTFS data is essential to serving the needs of customers.
While producing GTFS data should, in theory, be relatively easy (as the data structure consists of comma-delimited text files whose structure largely replicates that of existing transit scheduling system databases), that's often not the case for operations whose size/scale don't warrant a full-blown scheduling system.
What do these systems often use to reflect their schedules instead? Microsoft Excel.
For small bus networks, simple rapid transit lines, rail networks with practically nonexistent variability, etc., this is entirely workable. The challenge is, though, there historically hadn't been a particularly good way to create GTFS data from this. Sure, tools have existed to support this effort for small operations, but they're often not feature-rich and require a significant learning curve.
Enter Excel2GTFS. Download the relatively simple spreadsheet and enter the data for your network. Formulas at the top provide checks to ensure things are looking correct, and a script, well, converts the Excel sheet to GTFS.
The tool is also robust enough to support instances in which not all fields are populated, in which case, the files generated can be combined with existing ones to publish data updates. Output data can also be passed to some of the other GTFS tools, like Stringliner, to produce a stringline diagram of the GTFS service.

Walk Scores by Station
Plots of Redfin's Walk Scores by station for various railroads.
Note that the Walk Score does NOT reflect a station's walkability (e.g. how easy it is to access the station by walking, pedestrian infrastructure, etc.). Instead, the score reflects the geographic proximity to standard living amenities within a walkable distance of a given location.
Stations with a higher score are located in neighborhoods with sufficient amenities/destinations within a walkable distance, typically indicative of enabling a resident at that location to go about their lives and access basic necessities by walking. This typically correlates with having supporting infrastructure, but need not necessarily be the case.
Stations located at the edge of a walkable neighborhood may not reflect their walkability since the destination catchment area is measured from the station, rather than the downtown / livable area… even though the proximity from the station to the amenity is less reflective than the proximity from the downtown to the station and other destinations.
Certain stations may have scores that do not reflect actual walking access; e.g. stations located in parks or office complexes — despite potentially having good pedestrian facilities — typically score poorly as they lack proximate amenities like grocery stores that are considered essential to walkable life in such a neighborhood.
As an extreme example, two Metro-North stations (Breakneck Ridge and Manitou) that are both stops quite literally on a hiking trail have Walk Scores of 3/100 and 2/100, respectively. This does not reflect that the stations are not walkable, as they are both primarily accessed by walking. Instead, it reflects the lack of daily living amenities within a walkable distance since the stations are on hiking trails in the woods, far from amenities that would make life possible entirely by walking.
All tools and content © Jeff Kessler / KASDAT Consulting, 2016-2024. All rights reserved.